
Old Hampshire Mapped
Map Colours
IMGCOLOR.exe
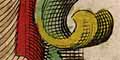
One of the ways of investigating the colours is to study an image file, using a computer program, to list and count the colours of the pixels. A very basic program has been written, IMGCOLOR.exe (using Borland Delphi/Pascal), to do the looking and counting. The program is a working tool, and is not written to be clever or fast! It reads a source file, which must be a Microsoft bitmap (.bmp) image file; it looks at each pixel in turn, using the RGB values to find the Hue, Saturation, and Brightness of the pixel, Hue expressed in degrees on a colour circle from 0 to 359, Saturation and Brightness as percentages 0 to 100; it produces a histogram of frequency of each hue in the image and tries to spot maxima in the frequency curve. There are two refinements; a small image of just a clean bit of paper copied out of the whole map image can be made. If this file exists the program ignores all pixels which look like paper, and counts the coloured bits only. Secondly the program is set to ignore pixels which are dark and have a very low saturation, the printing ink.For example, look at an enlarged piece of Norden 1607, the label Winchester and a settlement symbol to the east:-
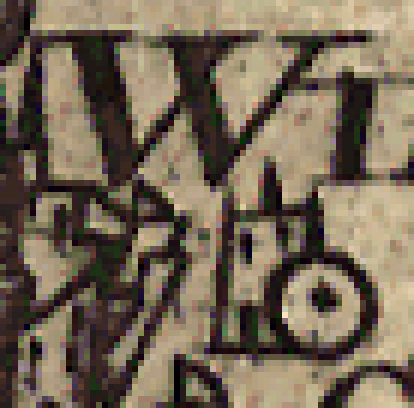
The dot in the middle of the settlement symbol has a centre made up of rows of 3, 4, 4 and 2 dots - the dark bits. The RGB values and hues of these pixels are:-
| pixel | R | G | B | Hue |
| 0,3 | 61 | 44 | 43 | 3 |
| 1,3 | 38 | 44 | 25 | 79 |
| 2,3 | 34 | 13 | 19 | 343 |
| 0,2 | 22 | 0 | 0 | 0 |
| 1,2 | 21 | 35 | 20 | 116 |
| 2,2 | 22 | 23 | 23 | 180 |
| 3,2 | 61 | 40 | 26 | 24 |
| 0,1 | 47 | 20 | 42 | 311 |
| 1,1 | 7 | 40 | 0 | 109 |
| 2,1 | 21 | 7 | 20 | 304 |
| 3,1 | 25 | 0 | 5 | 348 |
| 1,0 | 19 | 21 | 31 | 230 |
| 2,0 | 60 | 62 | 37 | 65 |
R/G/B = 65/85/42 hue 88and a pixel in the tint of a green border has values:-
R/G/B = 65/79/46 hue 85An algorithm to miss the first, which should not be counted, will miss the second, which should be counted.
The aim of the program is to count hues, ignoring their brightness and saturation. In a colour area the colours are likely to include pixels of a hue at various levels of saturation. Maybe counting the more saturated ones will be enough. The program setting to ignore low saturation pixels will probably ignore most of the dithering pixels.
Dithering is a procedure that adjusts the colours of neighbouring pixels to give an illusion of a wanted colour (I quote). It might appear right to the eye, but is wrong in the numbers.
It was decided to work with .bmp images because they are not compressed and they have a reasonably simple structure - so my programming problems were fewer!
The file structure is explained in
Murray, James D & vanRyper, William: 1994: Encyclopedia of Graphics File Formats: O'Reilly and Associates (Sebastopol, California, United States):: ISBN 1 56592 058 9; beware, there is at least one error in their explanationand the algorithm to convert between RGB and HSB colour spaces was found on the internet at:-
http://home.att.net/~rocq/HSB.txt
[Mkr].bmpwhere [Mkr] is a four character identifier (in HantsMap this is the 'short maker code'). Eg:-
Nrd1.bmpThe paper image file must have filename:-
[Mkr]_pap.bmpRunning the program all you do is select the image file: then wait, the process is not quick, there is a lot to do.
Nrd1_pap.bmp
[Mkr]_col.htmExamples:-
[Mkr]_col.bmp
[Mkr]pcol.bmp
[Mkr]h[0no].bmp
Nrd1_col.htmNrd1_col.bmp is a histogram of the hues in a tinted copy of John Norden's map of Hampshire, 1607, without counting 'paper' colour.
Nrd1_col.bmp
Nrd1pcol.bmp
Nrd1h070.bmp
Nrd1h132.bmp
Nrd1h240.bmp
Nrd1h250.bmp
Nrd1h300.bmp
Nrd1h357.bmp
Nrd1pcol.bmp is a histogram of the hues in a the paper of the map, which have been discounted.
Nrd1h070.bmp is a colour patch for one of the local maxima in the frequency distributaion.
The pattern of hues may still have some meaning, if one colouring is compared with another.
Looking at the title cartouche series, 5 differently coloured copies of Robert Morden's map of Hampshire, 1695, ('M2' series) it is less easy to be convinced that the software is finding anything meaningful.
The software has been run on a few maps in the Map Collection, but little has been done with the results. Writing the software has prompted a lot of interesting thinking, and that alone was worthwhile. But: here I stop.