 Map Group HEATHER 1797


dedication
map maker
engraver
publisher
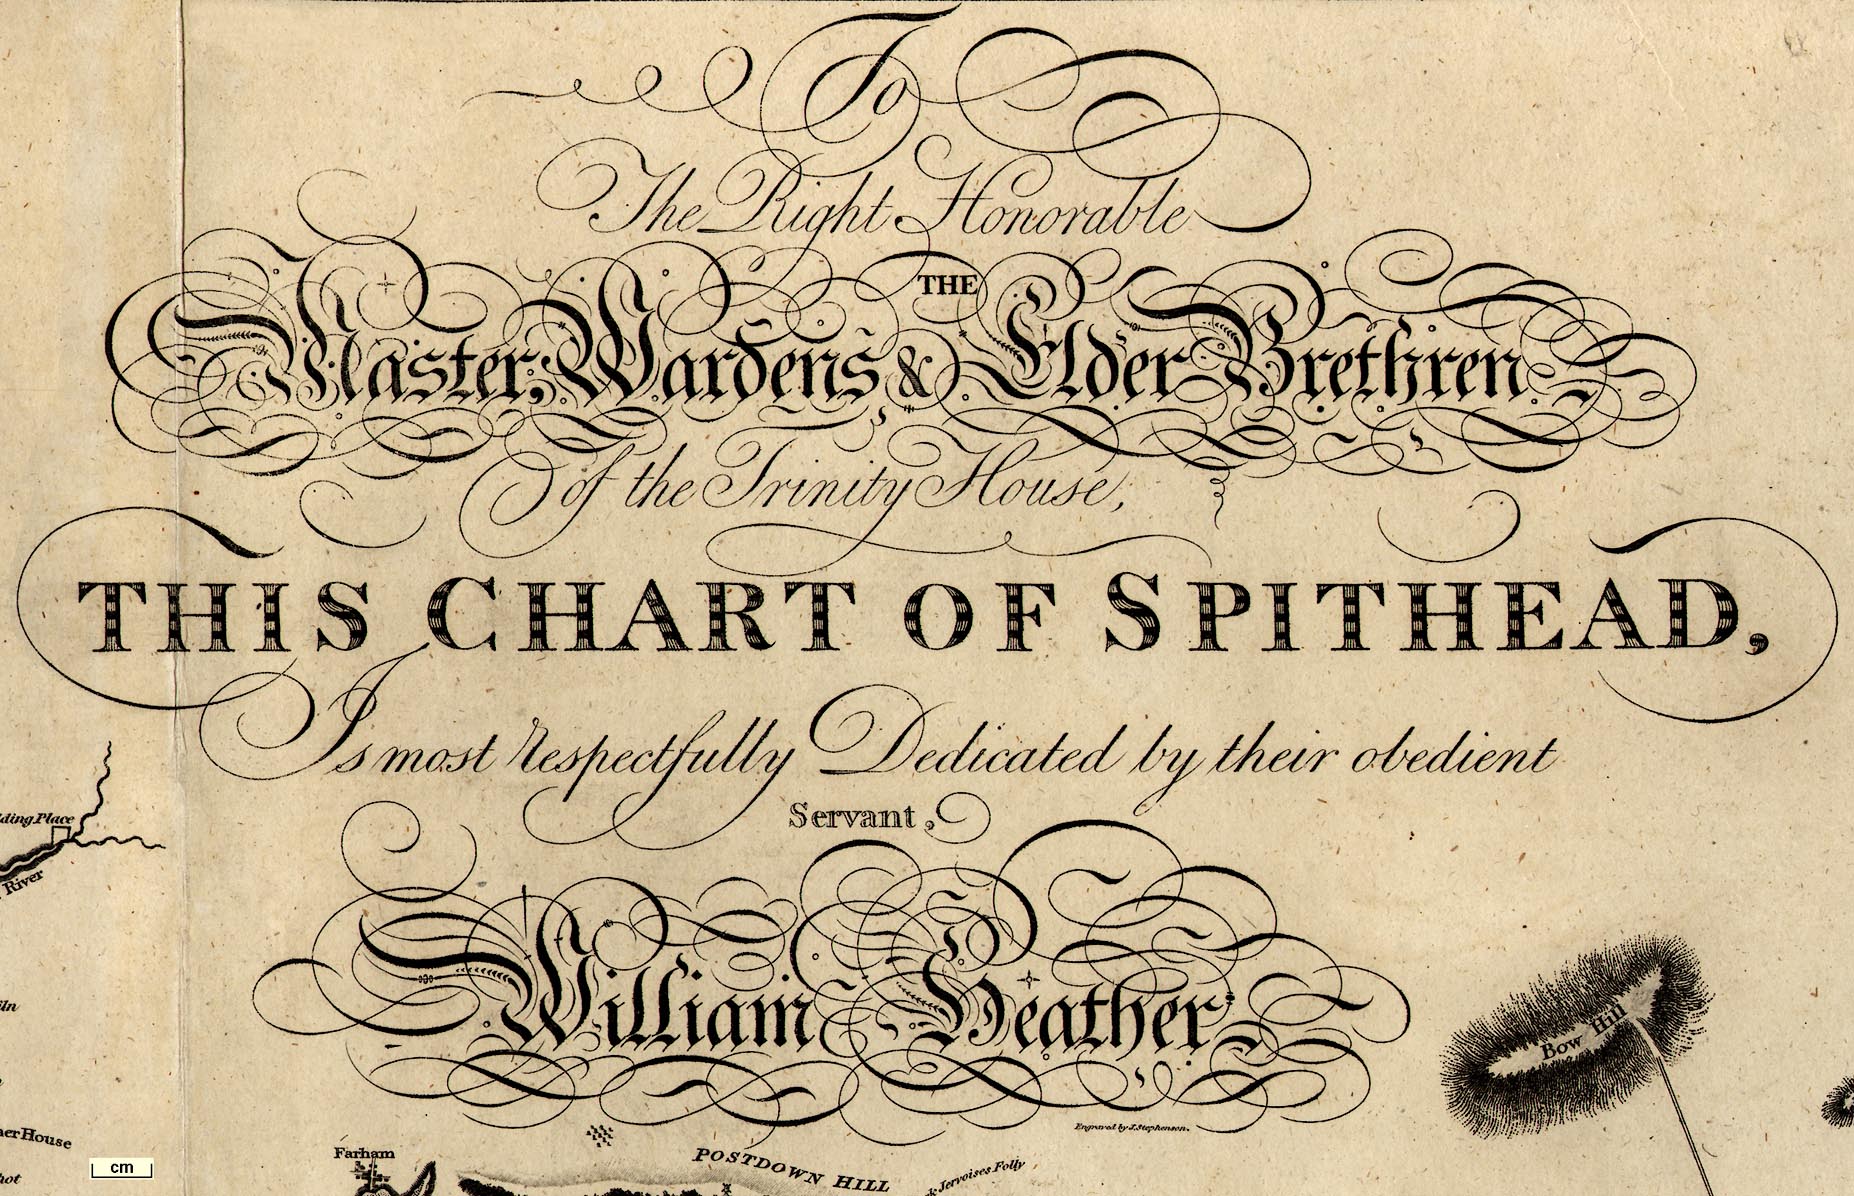
To / The Right Honorable / Master, Wardens & Elder Brethren / of the Trinity House, / THIS CHART OF SPITHEAD, / Is most Respectfully Dedicated by their obedient / Servant, / William Heather.The title is a riot of lettering, below which, very tiny, is:-
Engraved by J. Stephenson.At the bottom is printed:-
Published as the Act directs, Decr. 1st. 1797, by, HEATHER and WILLIAMS at the Navigation Warehouse, No.157, Leadenhall Street, London.
compass rose
rhumb lines
magnetic variation
MAGNETIC NORTH / or North by the CompassThe compass rose is oriented for magnetic, compass, north. True north is shown by a line marked with half a fleur de lys, labelled:-
True NorthThe arc of the angle between true and compass north is labelled:-
Varn. 2 1/4 Pts. W.The variation is
2.25x(360/32)=25.3125 degreesA 'point' is a by point, an 1/32nd of a circle.
There are secondary compass roses drawn in the sea east and west of the Isle of Wight. These just haave lines; bold for cardinal and half cardinal directions, dotted for false points, light for by points; all extended over the sea areas. On each, magnetic north is marked by a fleur de lys, and labelled:-
North by CompassTrue north is shown as before, and labelled:-
North of the WorldThe magnetic variation is labelled as before.
1 to 128000
1.75 nmiles to 1 inch
2 land miles to 1 inch.
NOTICE.
The Color of the Buoys is described thus ... [buoy symbol, unshaded] White [buoy symbol, shaded] Red [buoy symbol shaded] Black
Rocks under Water ... [group of symbols like plus signs]
Rocks above Water ... [rocks shaded to the east]
Sand Banks ... [hachure and dots]
Towns ... [street plan]
Direction of the Stream of Flood ... [arrow]
Leading Marks ... [double line]
Safe Anchoring Places ... [anchor symbols]
Times of High Water ... XI
The Figures shew the depth of Water in fathoms at Low water.
sea plain
sandbanks
buoys
wrecks
depth soundings
anchorages
Some sea areas, channels, etc are named, eg:-
Christ Church Bay
SPITHEAD
Langstone ChannelSandbanks are clearly shown by dotted areas, the density of dotting suggesting the different depths of the hazard. The presence of rocks below or above water (at low water?) is shown by rock symbols. Many of the hazards are named, eg:-
HORSE DEAN
Bramble
Christ Church Ledgeand some have helpful descriptions, eg:-
Mud
Dry at Low Water
Shifting Ground
Breakers
Dry at EbbThere are symbols for buoys, labelled with its colour; red, white, or black. Many of these mark sandbanks, for example the Bramble has a red buoy at its west end, a white at the east.
A buoy might have a name, eg:-
Outer Buoyon the Horse Sands, and:-
Spitin Spithead.
A buoy might mark a wreck, which is named, eg:-
R. George
Edgarfor wrecks off Spithead. HMS Edgar, 3rd rate ship of the line, 70 guns, blew up and sank, 12 October 1711. HMS Royal George, flagship of Admiral Kempenfelt, sank while her hull was being repaired, 1782.
Off the coast near the Bramble is:-
overfallsDepths of water in fathoms at low water are given over the whole sea area, out to about 20 fathoms. Deeper parts are just given in fathoms; shallower soundings are given more accurately, to the half fathom. Soundings continue into harbours and up rivers to 1 fathom. There is no attempt to show depth contours.
Anchorages are indicated by an anchor symbol; the flukes facing left, down, or right. (What does this mean?) There might be added information, eg:-
good anchoringin Christchurch Bay These symbols do not appear in estuaries and harbours, where anchorage is taken for granted?
tides
Velocity 3 Spring Tides
2 NeapThese are presumably in knots.
(There is nothing to suggest double tide effects in the Solent/Spithead.)
Times of high water are given at various places by roman number, for hours, perhaps with arabic figures for parts of an hour, eg:-
IX [Christchurch Bay]
VIIIh.56' [SW of The Needles]
XI 3/4 [Southampton Water]The chart does not say what reference place is taken for the time of high water to which these times are comparitive.
The likely interpretation for a map of this period was given by Cmdr John Page, tidal branch of the Hydrographic Office, Taunton. The times given are the 'high water lunitidal interval'. The time of high water is given as the time in hours and minutes after the transit of the moon at the Greenwich meridian.
leading lines
sea marks
For example two forts:-
Kicker
Moncton Fortdefine a leading line labelled:-
The Kicker and Moncton Fort in oneie sighted in line. Or, an unnamed windmill NW of Hamble, and a building:-
Hook Summer Housedefine a leading line labelled:-
Clears the BrambleLeading lines enable the mariner to gauge his position relative to visible features on the coast avoiding hidden dangers below. All this if there is visibility.
headlands
foreshore
islands
sea marks
lighthouses
Hengistbury Head
Stans Ore Pt.
Cliffs
Soley hardDotted areas show foreshore along the coast.
Islands are cleared charted, using the same coast line as the main land, and might be labelled, eg:-
Binster Is.
Horsey
Pewit I.A ?lighthouse is drawn near Hurst Castle, a tower labelled:-
Light
Jack in the BasketA ?beacon on the sandbank off shore of the Lymington River eastuary and channel is drawn as a ?cresset, a fire basket, on a post, labelled:-
harbours
docks
bridges
Bowley River
Titchfield CreekThe dockyard at Portsmouth is labelled:-
DockBridges are shown across rivers where they mark an end to navigation. They might be named, eg:-
Boulder Bridge
streets
town - block caps italic, eg:-
GOSPORTtown/village - lowercase upright, eg:-
Lymingtonvillage - lowercase italic, eg:-
HavantBut this is may not be well controlled. Within the settlement a church is drawn as a building with a tower; it's a visible navigation point. Similarly individual houses might be drawn as a building, windmills by a post mill symbol, etc. Some of these are named. On Portsdown there is:-
Clerk Jervoises Folly
Salt Houses
castles
fortifications
Hurst Castle
Calshot Castle
Netly Castle
Old Castle [ie St Andrew's]
South Sea Castleand forts:-
Moncton Fort
Blockhouse Fort
Mud Forts [Southsea shore]
Cumberland FortFortifications are drawn round Gosport and Portsmouth.
hill hachuring
Portsdown Hill
Building Placepresumably ship building. The position is where Buckler's Hard is today.
Hospital


