 Map Group KNIGHT 1799


map maker
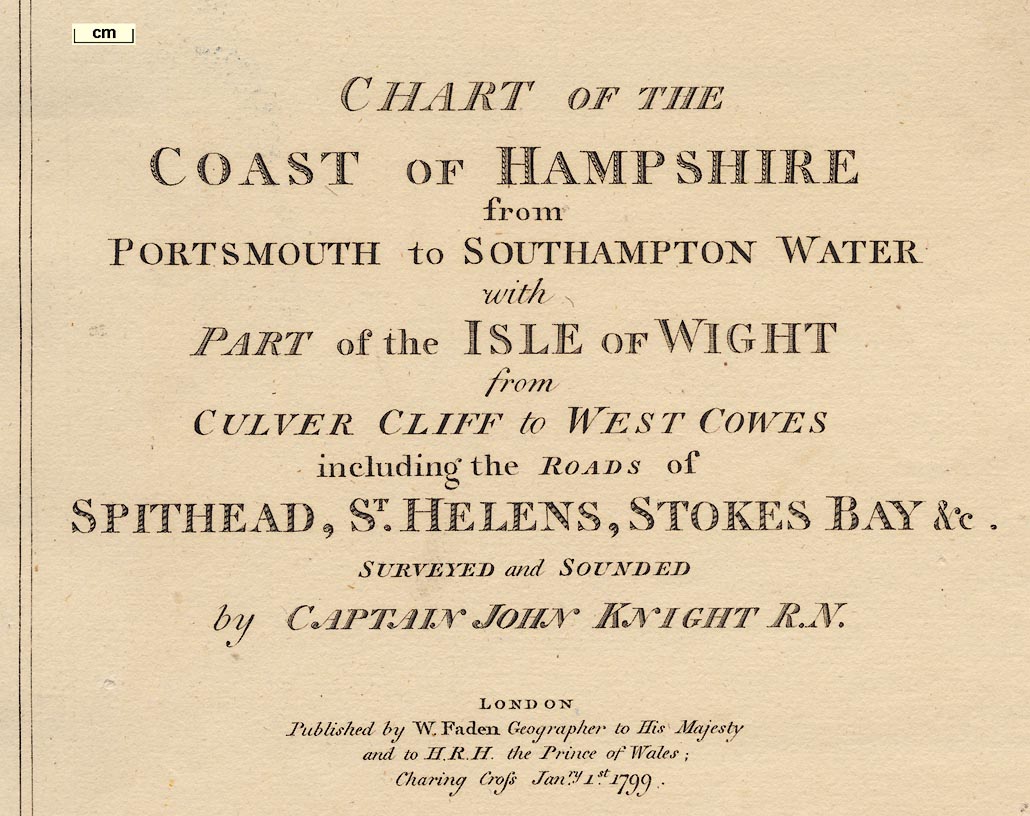
CHART OF THE COAST OF HAMPSHIRE from PORTSMOUTH to SOUTHAMPTON WATER with PART of the ISLE OF WIGHT from CULVER CLIFF to WEST COWES including the ROADS of SPITHEAD, ST. HELENS, STOKES BAY &c. SURVEYED and SOUNDED by CAPTAIN JOHN KNIGHT R.N. LONDON Published by W. Faden Geographer to His Majesty and to H.R.H. the Prince of Wales; Charing Cross Janry. 1st. 1799
scale
Scale of One Leaguechequered in quarter miles then miles, labelled at 1 mile intervals. The 1 league = 3 nautical miles of 6082 feet = 138.8 mm gives a scale 1 to 40068. The map scale is about:-
1 to 40000
1 1/2 inches to 1 [land] mile
Longitude of the Royal Academy at Portsmouth 1[d].6[m].15[s] West from Greenwich
Latitude ... ... Do. ... ... 50[d].48[m].00[s] North
up is N
magnetic variation
Varn. 23[degree] W.between them. Up the page is current magnetic north.
coast appearance
castles
fortifications
Calshot Castle
South Sea CastleMore modern defences are drawn as artillery style angular fortifications, at:-
Fort Monckton
Fort [Lumps?]
Cumberland FortBut also notice the heavy fortifications around Gosport, Portsmouth, and the Dock Yard. And notice the associated:-
Haslar Hospital
Magazine [still fairly new at Priddy's Hard]
Dock Yard
The Lines [Portsea Island shore at Ports Creek]
Hilsea Barracks
hill hachuring
PORTSDOWNis drawn, with a:-
Clump of Trees
Wind Millmarked in position.
trees
roads
street map
windmills
roman forts
Porchester Castle is drawn, with buildings within, and the great tower obvious. Somewhen about this period the fort was in use as a Prisoner of War camp for captured French.
Telegraph


depth soundings
sandbanks
buoys
sea marks
leading lines
wrecks
anchorages
harbours
SPITHEAD
STOKES BAYDepth soundings are marked across the sea areas, figures giving depth in, I assume, fathoms and sometimes to the half fathom. The soundings are arranged in irregular lines, as they were made by short exploratory trips across the seas.
Sandbanks are shown as pecked areas, the pecking denser towards the edges, which is counter intuitive. Soundings continue across the shallows, and are sometimes given in feet. Some shallows are labelled, eg:-
BRAMBLE
Long Middlewhich has one sounding of:-
16 feetpresumably a warning of least depth. It is not stated what the state of the tide is when soundings are made. The present day convention, reading off a Hydrographic Office chart, is at the 'level of Lowest Astronomical Tide' which presumably means spring tide low, without wind or other weather effects.
Many buoys are marked, drawn by a cone symbol which probably represents the shape of buoys at the period. These are labelled with colour, eg:-
Red
Whiteat the west and southeast edges of the Bramble. And:-
Horse / Black
Elbow / Black
Third / Black
Dean / Black
Outer / Blackround the west edge of the Horse and Dean Sands.
Some shallows are also marked by a post with a flag, for example at the south edge of Calshot Spit.
Leading lines are drawn, for example lining up Southsea Castle with the headland at Fort Monckton to avoid the Middle shallows.
Some wrecks are marked, eg:-
Wreck of the Royal George
Boynes WreckAn anchorage is marked by an anchor symbol between Spithead and the Spit Bank.
The two harbour areas:-
PORTSMOUTH HARBOUR
LANGSTON HARBOURare labelled. Channels within the harbours are made clear by the drawing of shallows, sand banks or foreshore areas. And some islands are shown, eg:-
Horsea I.
Whale I.in Portsmouth Harbour.
IN a channel just north of the dock yard there is an array, 2 by 4, of ship shapes, presumably marking a naval anchorage.


