 Map Group OS 1920s POPULAR EDITION

Popular Edition
These brief notes are about Hampshire as shown on sheets of the One inch map Popular Edition, published by the Ordnance Survey from 1918-31. The maps studied are in the Map Collection of Hampshire CC Museums Service, items HMCMS:FA2003.7.112, FA2003.7.113, B1972.67.36, FA2003.7.122, FA2003.7.123, FA2003.7.124, FA1971.424, FA2003.7.132, FA2003.7.141 and FA2003.7.142.


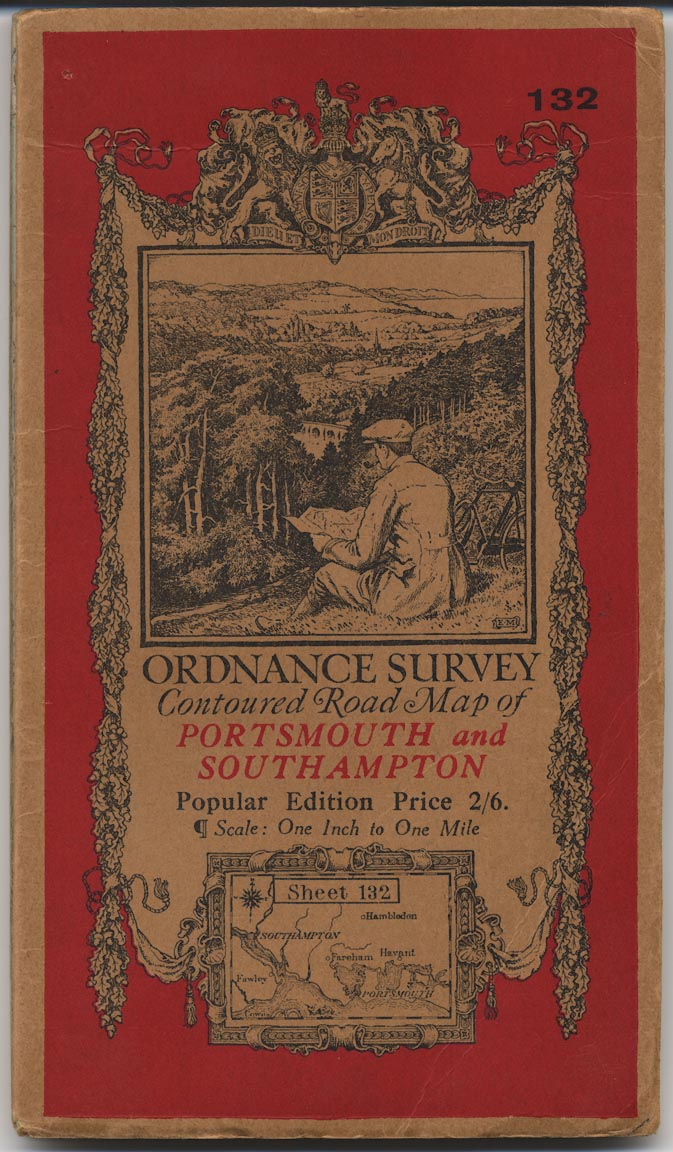
E.M
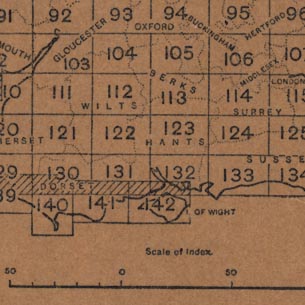
On the back cover there is (sheet 132) an index map of Great Britain showing the arrangement of sheets in the whole series, variously captioned:-
Published by Authority of the Ministry of Agriculture and Fisheries
'ONE-INCH' ORDNANCE MAPS OF GREAT BRITAIN
Sheet lines of the 'ONE-INCH' POPULAR EDITION of SCOTLAND.
Sheet lines of the 'ONE-INCH' POPULAR EDITION of ENGLAND & WALES.
...The index map has a scale line.
Other printings of these maps have an index map of the south of England and Wales only (eg sheet 141). The Hampshire area is:-


Marlborough and Devizes
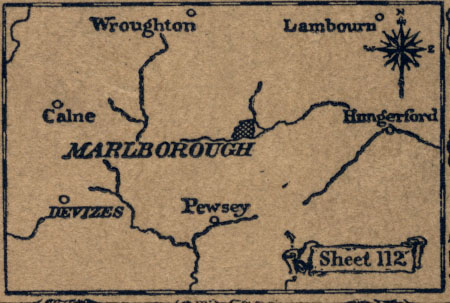
ST946525; ST948814; SU383811; SU381521
parts of Wiltshire, Berkshire, and a corner of Hampshire.
Wiltshire places:-
Marlborough & DevizesBerkshire places:-
Hungerford
Reading and Newbury
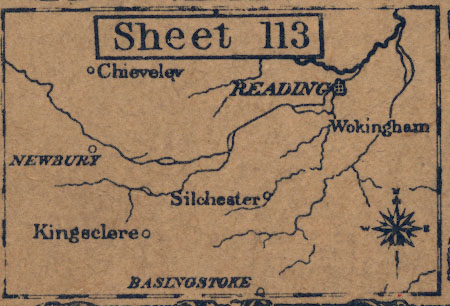
SU381521; SU383811; SU817807; SU814517
parts of Berkshire, corner of Oxfordshire, and parts of Hampshire.
Berkshire places:-
Reading & Newbury & AldermastonHampshire places:-
Basingstoke & Kingsclere
Windsor
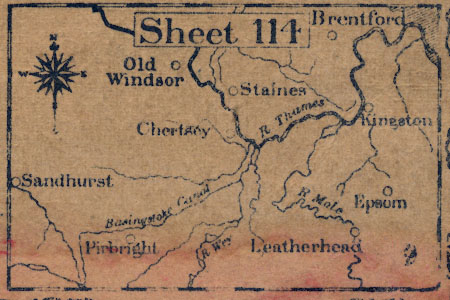
SU814517; SU817807; TQ252803; TQ250515
parts of Berkshire, Buckinghamshire, Middlesex, London, Surrey, and Hampshire.
Surrey places:-
BagshotMiddlesex places:-
Staines
Salisbury and Bulford
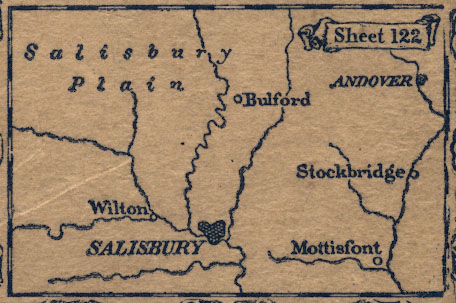
ST943235; ST946525; SU381521; SU377231
parts of Wiltshire and Hampshire.
Wiltshire places:-
Salisbury & Amesbury & LudgershallHampshire places:-
Andover & Stockbridge
Winchester and District
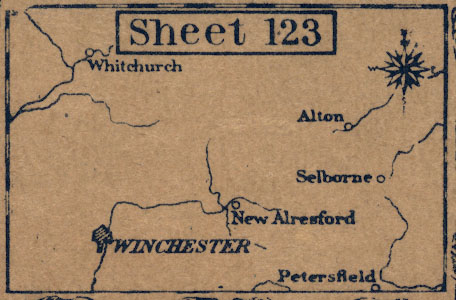
SU377231; SU381521; SU814517; SU812228
small parts of Surrey and West Sussex; and parts of Hampshire.
Hampshire places:-
Alton & Basingstoke & New Alresford & Odiham & Petersfield & Whitchurch & Winchester
Guildford and Horsham
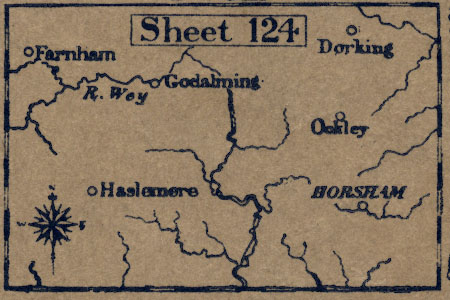
SU812228; SU814517; TQ250515; TQ246232
parts of Surrey, West Sussex, East Sussex, and Hampshire.
Surrey places:-
Farnham & Godalming & Guildford
Wimborne and Ringwood
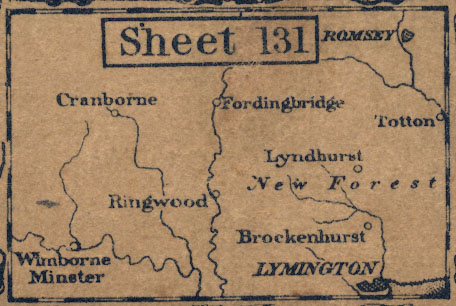
SY941941; ST943235; SU377231; SZ375942
parts of Wiltshire, Dorset, and Hampshire.
Hampshire places:-
Fordingbridge & Lymington & Ringwood & RomseyWiltshire places:-
DowntonCranborne & Wimborne Minster
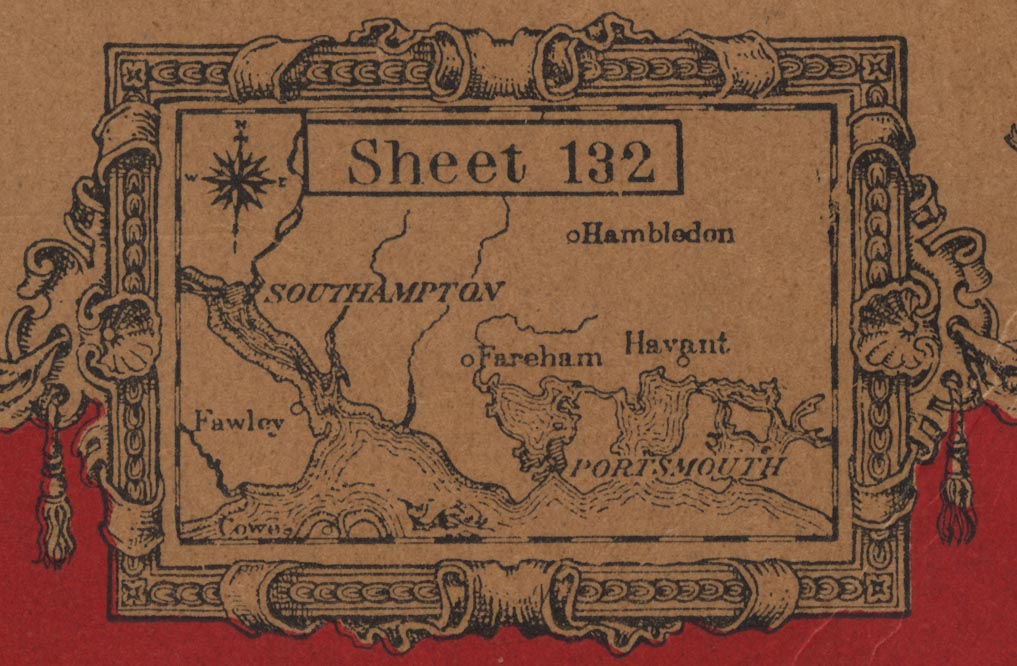
Portsmouth and Southampton
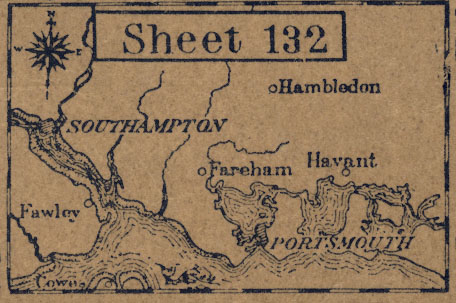
SZ375942; SU377231; SU812228; SZ809948
parts of West Sussex and Hampshire.
Hampshire places:-
Bishops Waltham & Fareham & Gosport & Havant & Portsmouth & Southampton
Bournemouth and Swanage
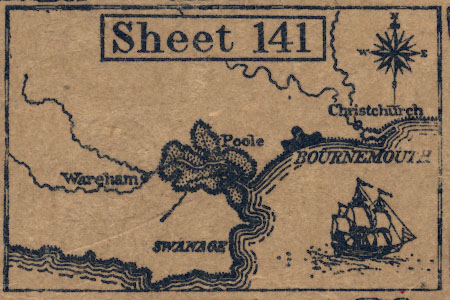
SY793755; ST795045; SU230040; SZ228750
parts of Dorset and Hampshire, some of which is now Dorset.
Dorset places:-
Christchurch & Poole & Wimborne Minster
Isle of Wight
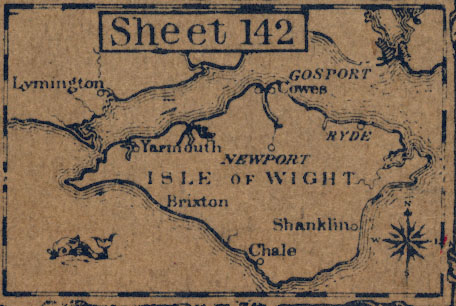
SZ228750; SU230040; SU665036; SZ662747
parts of Isle of Wight and Hampshire coast.
Hampshire places:-
Gosport & Lymington & Portsmouth


I make no apology for presenting these notes about maps which are so well known and so well described by far more knowledgable writers on OS maps. The comments are all made in the pattern used for early printed maps of the county; and may thus be inept for such modern maps as these, but can be set against the other descriptions for comparison. Limited comments are made about each of a limited range of features. For consistency most notes are taken from looking at the example of sheet 132 in the Map Collection, which is also used for many of the snip images of features. Other prints of sheet 132 might differ in some details, the HMCMS example is a buff border cover type; other notes are taken from sheet 141 as next choice, this type has no buff border on the cover.
black - outline detail;
green - woodland;
orange - contours, there are no hachures;
red and brown - classified roads, A and B categories as laid down in the Ministry of Transport Act 1919;
lighter blue - water, the sea;
darker blue - water, rivers and depth contours.
map maker

PORTSMOUTH & SOUTHAMPTONin decorative block caps.
Further along at the top is other handy information, eg (sheet 132):-
POPULAR EDITION ONE-INCH MAP
SHEET 132 (Hampshire & Sussex)and to the left:-
ORDNANCE SURVEY OF ENGLAND AND WALESPrinted at the bottom right is data about survey, engraving, corrections, etc, eg (HMCMS sheet 132):-
First published by The Director General, at the ORDNANCE SURVEY OFFICE, SOUTHAMPTON, 1919, with periodical corrected reprints.and on another example (HMCMS sheet 141):-
Engraved at the ORDNANCE SURVEY OFFICE, Southampton.
Surveyed in 1862-88 and Published in 1892-3.
Revised in 1893-96 and in 1903.
Revised (3rd Revision) in 1913.
Published by Colonel Sir Charles Close, K.B.E., C.B., C.M.G., Director General.
Printed at the Ordnance Survey Office, Southampton, 1919.
Railways inserted to 1922.
Reprint 4000/23.These notes are not the place for a complicated description of the revision and printing history of the Hampshire sheets.
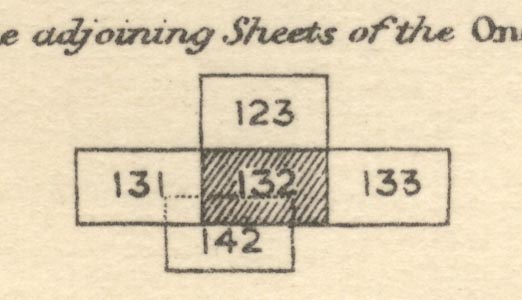
No. of the adjoining sheets of the One Inch maps.
compass rose
magnetic variation
up is N

Printed in the [probably] upper right border of the map, or perhaps in an otherwise blank sea area, is a compass rose; no circle, decorated lines for cardinal and half cardinal directions, North marked by an arrow and fleur de lys. A magnetic north line is also given accompanied by a statement like (sheet 132):-
Magnetic Varn. 15[degrees] 44[minutes] W Jan. 1925. Annual decrease 10[minutes] (not constant)
scale
1 to 63360
1 inch to 1 milePrinted above the bottom scale line:-

Scale of One Inch to One Statute Mile 1/63360Apart from the inevitable stretch and shrink of paper with change of relative humidity these maps are reliably accurate in their scale. The map's projection has associated errors which are not significant in these small scale maps.

Printed in the map borders are sales of latitude and longitude; chequered at 1 minute intervals, labelled at 5 minutes intervals.
(This note is at the edge of my knowledge and comprehension; beware.) The projection used for the Hampshire sheets of this map series is a Cassini projection using a central meridian at Greenwich, and perhaps a central meridian base on Butterton Hill for the westerly sheets.
Johnston 1920, questions after his paper, Col Whitlock:-
... The new one-inch popular edition is squared wih two-inch squares. This enables anyone to judge distances pretty accurately. ...It isn't really an index grid at all?


sea tinted
depth contours
sandbanks
lighthouses

SPITHEAD
THE SOLENT
Stokes BayJohnston 1920:-
... The sea is printed in a solid tint in contrast to the lined efect on the older maps. ...Depth contours are drawn in darker blue at 5 fathom intervals, labelled in fathoms:-
Sandbanks surrounded by water and submarine contours are based upon Admiralty Surveys, the datum of which is approximately Mean Low Water Springs.
The Submarine Contours are given in Fathoms, and are taken from the Soundings of Admiralty Surveys.Sandbanks are mostly not labelled? though on sheet 132 there is:-
Spit Sandlabelled off Haslar, with a buoy at the end, etc. As well a few buoys the maps might show lighthouses or lightships. At Calshot (sheet 132) there are two lights, labelled:-

Calshot Spit Lightship
Calshot Lightfloat
coast appearance

Some of these areas might be labelled, eg (from sheet 132):-
Thorns Beach
Little Marshboth west of the Beaulieu River estuary; and:-
Hamble Spit
East Winneretc. The coast appearance might be drawn, as at Ballard Point and around Durlston Head in Dorset (sheet 141) where hachures show lower or higher cliffs. Some headlands might be labelled, eg (from sheet 132):-
Needs Oar Point
Stone Point
Gilkicker PointHarbours are clearly drawn, with channels and islands among the mudflats, and labelled, eg:-
Titchfield Haven
Portsmouth HarbourThe large docks are shown at Southampton, eg:-

The Docks
castles
fortifications
The old coastal defence castles might be noticed, as (on sheet 132):-

Calshot Castlemarked by a circle symbol not a ground plan, labelled in english black letter, with additional information:-
(Seaplane and Wireless Tel. Sta.)and notice:-
Castle [Netley]
South Sea CastleDrawn in outline. Other fortifications are mostly missing from the map? There is a simple outline of polygonal fortifications at Gilkicker, unlabelled; Haslar Hospital is plotted; the chain of forts defending Gosport are drawn in outline, unlabelled; the forts on Portsdown are absent; the Royal Dockyard is plotted; Lumps Fort and Fort Cumberland are just outlined, not labelled.
bridges
fords
ponds

Wallington River
RIVER ITCHEN
Cove BrookIn river estuaries, as the river widens, the darker blue gives way to the lighter blue of the sea, with darker blue shading, done with a pattern of spots, at the edges. Further down still the foreshore is printed as described above:-

Johnston 1920:-
... In the new maps the rivers and streams are drawn solid, whereas on the old maps they retained their engraved form. ...Bridges are drawn with a recognisable bridge symbol under a road, or railway. Some bridges are named, eg:-

Northam Br.A ford might be drawn across a road, eg:-

Fordacross the Sandhurst to Darby Green road crossing the Hampshire boundary.
Ponds are drawn in outline, tinted blue, eg:-

Fleet Pond


contours
spot heights

Park Hill / 670

514on Broadhalfpenny Down
It is hard to follow a contour round the map till a label is found, by which time you've probably lost where you started.
Spot heights are given by a figure, with the spot marked by a dot in a triangle. Spot heights on roads are a figure by a dot.
Johnston 1920, questions after his paper, Major General Lord Edward Gleichen:-
Do I understand you to say that these 'popular' one-inch maps are approved of for military purposes? It occurs to me that one does not grasp the lie of the ground anything like as quickly .... does not differentiate hills and valleys ...The stonewall reply was:-
It has been accepted by the War Office.Printed at the bottom of the map is:-
The Altitudes and Contours are given in Feet above Ordnance Survey Datum (Mean Sea Level.)
Contours surveyed on the ground, 50', 100', 200', 300', 400', 500'. 600', 700', 800'., Other contours interpolated and only approximately correct.Johnston 1920:-
... it will be noticed that the contours, instead of being at 100 and 250 feet apart, are now uniformly at 50 feet vertical interval. The interpolated contours have been engraved from the 2-inch hill drawings and from spot levels. The old contour lines, viz. 50 feet, 100 and every 100 feet up to 100, and every 250 above that height, had been previously surveyed on the ground.
forests

Stoke WoodNNW of Hambledon. On sheet 132 the:-
FOREST OF BEREmeaning East Bere Forest, is labelled across an area north of Havant, with some areas of woods.

Southwick Ho.Parks are no longer very significant.

The county boundary appears to be a dot dash line, which in the table of symbols is a county and parish boundary. A county boundary is meant to be a dotted line. There seems to be some confusion; and the maps do not show parishes anyway!
Johnston 1920:-
... it will be observed that only county boundaries are shown on the new maps. Parish boundaries which caused so much confusion with footpaths have disappeared. ...All counties are labelled in borders of map, eg:-

HAMPSHIRE | SURREYRemember that these maps are not 'county' maps; they are not maps of Hampshire in particular.
streets
The conventions for labelling settlements were published in a sixpenny sheet by the Ordnance Survey in the 1930s. Not having a full set of Hampshire sheets, these notes are abbreviated.
WINCHESTER

FAREHAMLarger towns might be in large italic block caps, eg:-
PORTSMOUTH

Hambledon

Durley Street


spot heights
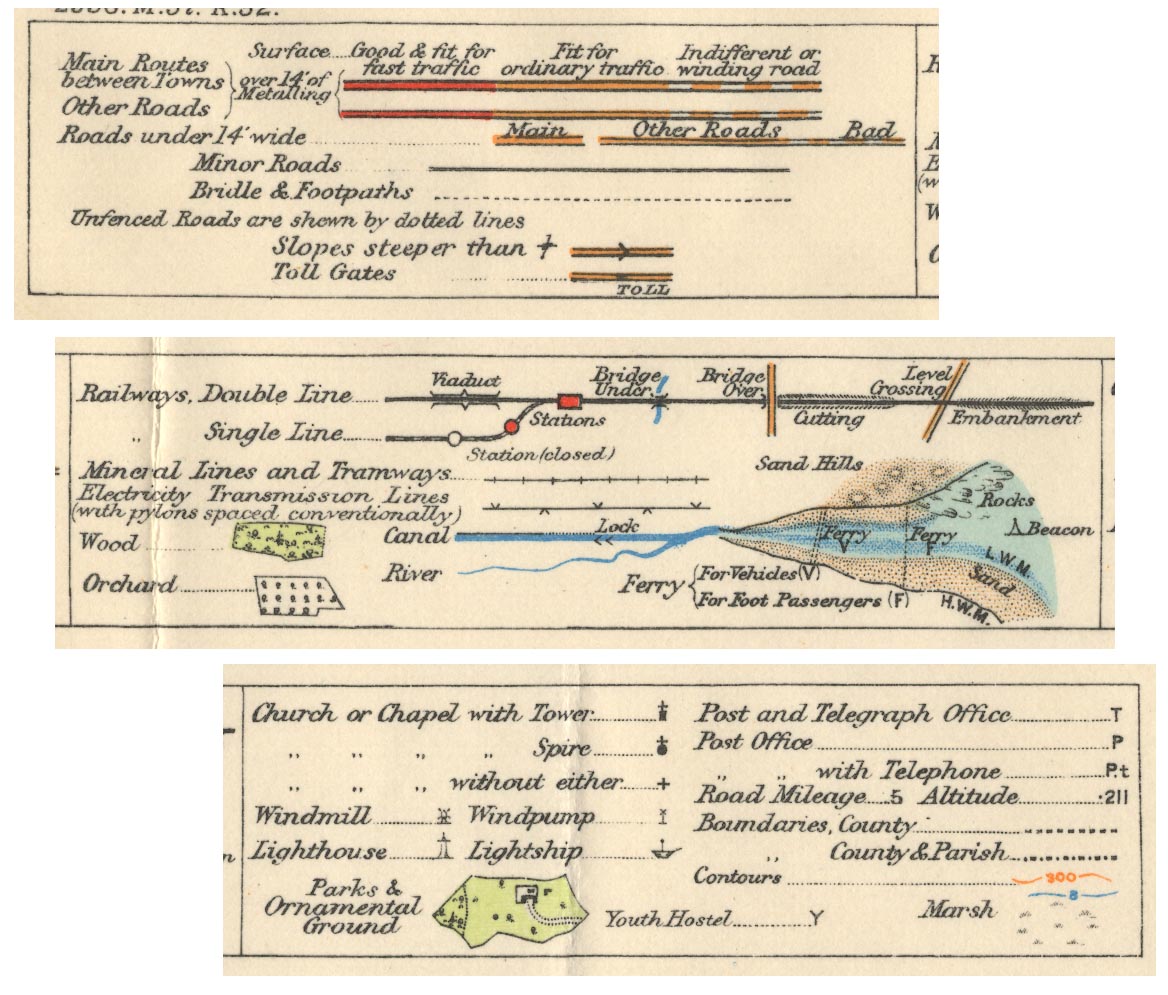
Ministry of Transport Act 1919and are described in the contemporary handbook to the OS small scale books:-
... 1st class roads red, 2nd class roads (fit for ordinary traffic) brown, 3rd class roads (indifferent or winding) chequered brown. Minor roads in uncoloured outline. ...For example (sheet 132):-

roads west of Fair Oak: red, brown, brown/white chequered, white, solid and dotted, and a spot height.
Johnston 1920:-
... the Road Classification stands out in a very marked degree. There is no mistaking the first-class roads, and users of motor cars can easily pick out roads available for their use. ...and in questions after his paper, Col Whitlock:-
The roads where considered by a committee of representatives from the War Office, Road Borda, the Automobile Association, and an officer from the Ordnance Survey, and their recommendations ... the main roads are easily seen, and I think that the map is one that will appeal to motorists and cyclists and other people who use the road. ...

Basingstoke Canal
Eelmoor BridgeThe wide area is Eelmoor Flash; a flash is a swamp not a winding point.

S.R. Worksshowing part of the London and Southampton Railway, the junction with the Bishopstoke to Gosport branch railway, and Eastleigh Works of the London and South Western Railway, LSWR. And more anonymously:-

cutting and embankment drawn by hachures, over bridge and under bridge, ... Stations are marked by a red filled rectangle or circle, an uncoloured circle if disused.

Flying Track
Laffans Plainnear Farnborough where the army and later the Royal Flying Corps experimented.
Several airfields are marked, eg:-

Aerodromewhat is now Eastleigh Airport.
And there are several indications of flying boats in The Solent area, eg:-

Seaplane Sta.at Hythe


Race Courseat Paulsgrove

Brick WorksSW of Chandlers Ford

SmithyE of Botley; elsewhere:-
Smy.
hillforts
tumuli

Tumulus [english black letter]on Yateley Common
water mills
windmills

Durley Milla water mill on the River Meon.

Old Windmillthis is Bursledon Windmill, which is a tower mill; the symbol is a conventional symbol for a windmill, a postmill.
Innthough it is not often clear which building is meant in a village. On a road the building might be marked clearly, eg:-

Ely Innby the London road between Blackwater and Basingstoke, on Yateley Common.

Marlborough Linesin North Camp, Aldershot


: 1930 (?): Description of the Ordnance Survey Small Scale Maps: Ordnance Survey (Southampton, Hampshire)
Browne, John Paddy: 1990 (about): Map Cover Art: Ordnance Survey (Southampton, Hampshire):: ISBN 0319 00234 9
Harley, J B: 1975: Ordnance Survey Maps, a descriptive manual: Ordnance Survey (Southampton, Hampshire)
Hellyer, Roger: 1999: Ordnance Survey Small Scale Maps, indexes 1801-1998: Archer, David (Kerry, Montgomeryshire)
Hodson, Yolande: 1999: Popular Maps & Ordnance Survey Popular Edition One Inch Map of England and Wales 1919-1926
Johnston, W J, Col: 1920: New One Inch and Quarter Inch Maps of the Ordnance Survey: Geographical Journal: vol.55: pp.192-200
Owen, Tim & Pilbeam, Elaine: 1992: Ordnance Survey, Map Makers to Britain since 1791: Ordnance Survey (Southampton, Hampshire):: ISBN 0 319 00498 8 (pbk)
Steers, J A: 1965 (14th edn) & 1925: Introduction to the Study of Map Projections: University of London Press


